How To Use
Exmaple-1: A TERT promoter mutation and its surrounding multi-omics status |
 |
A. Show the TERT gene region
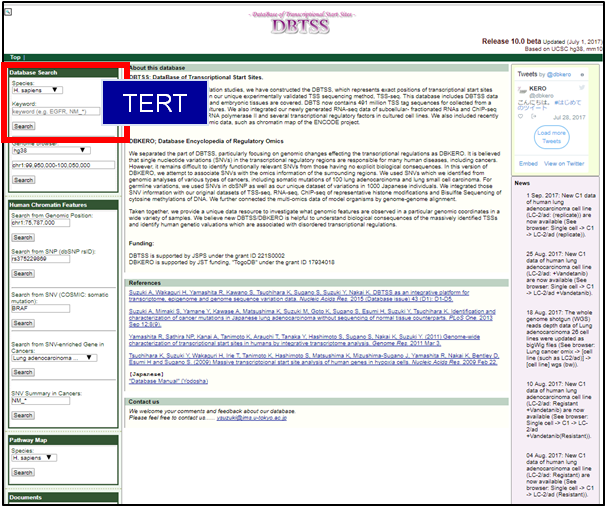
1.Go to the top page of DBTSS (https://dbtss.hgc.jp/)
2.Input ‘TERT’ to the keyword field at top left and click the search button.
|
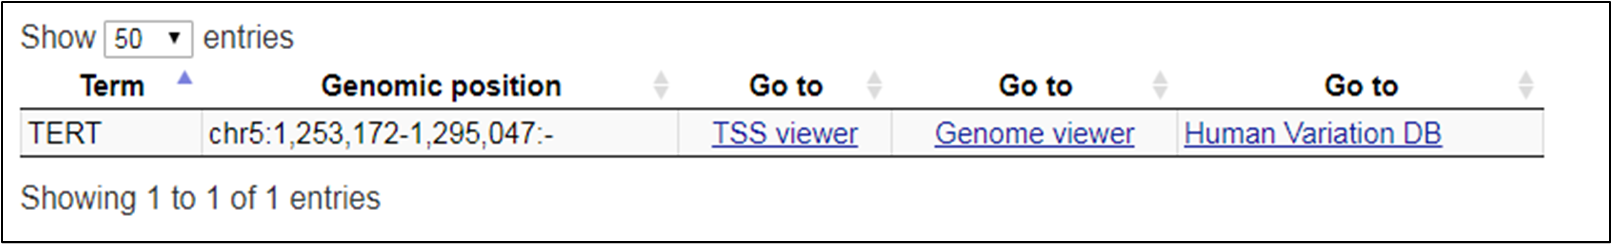 |
3.Select the genome browser.
|
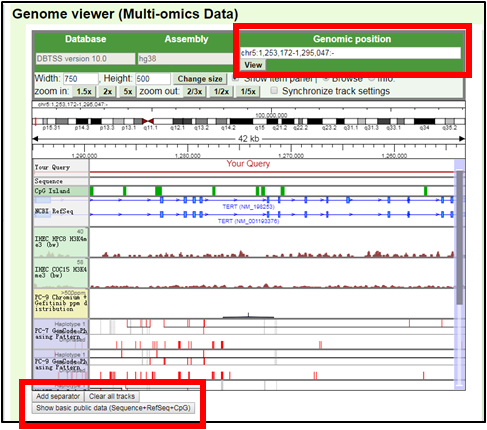 |
4.The user can see the TERT gene region at the genome browser. TERT is located on the minus strand of the reference genome.
If the user want to show the plus strand, erase ‘-’ from the genomic position.
5.The user can reset contents by ‘Clear all tracks’ and show the basic items by ‘Show basic public data (Sequence+RefSeq+CpG).’
|
|
B. Select the clinical and model datasets |
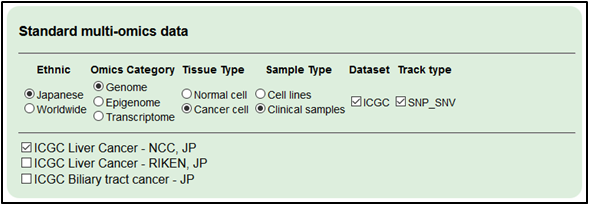
1.Select the cancer dataset. Select ‘Japanese,’ ‘Genome,’ ‘Cancer cell’, ‘Clinical samples’, ‘ICGC’ and ‘SNP_SNV.’
・ICGC Liver Cancer- NCC, Japan
|
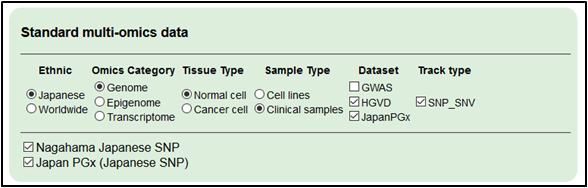
2.Select the Japanese germline variation datasets for references.
Select ‘Japanese,’ ‘Genome,’ ‘Normal cell’, ‘Clinical samples’, ‘HGVD and Japan PGx’ and ‘SNP_SNV.’
・Japan PGx
・Nagahama SNP
|

3.Select the germline variation in other ethnic groups for references.
・dbSNP
・NHLBI ESP
・1000 Genomes
|
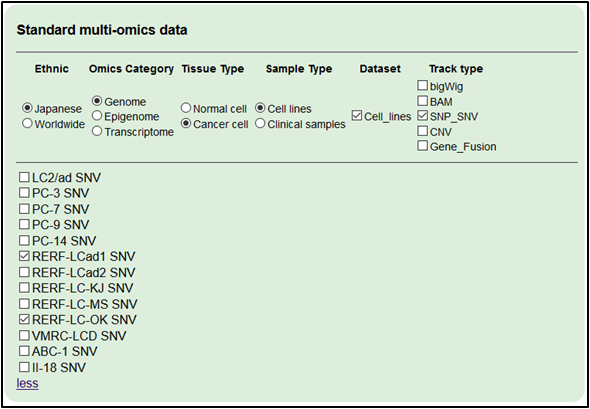
4.Select the Japanese lung cancer cell line datasets as model systems.
・RERF-LC-Ad1 SNV
・RERF-LC-OK SNV
|
|
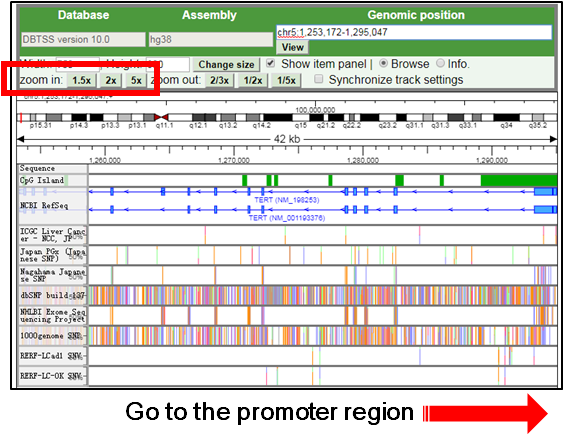
C. Go to the TERT promoter region |
|
|
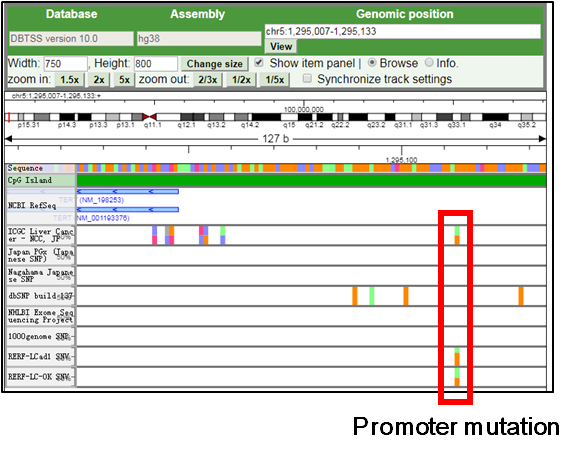
1.For focusing on the TERT promoter mutation, drag and scroll the view to the promoter mutation (chr5:1295113) and zoom-in.
(link )
|
|
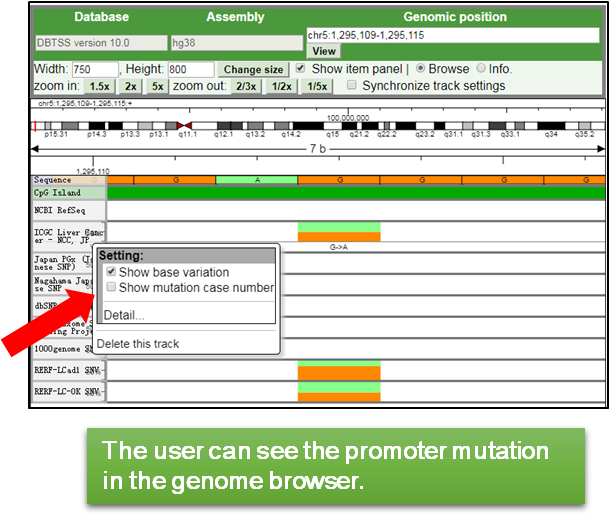
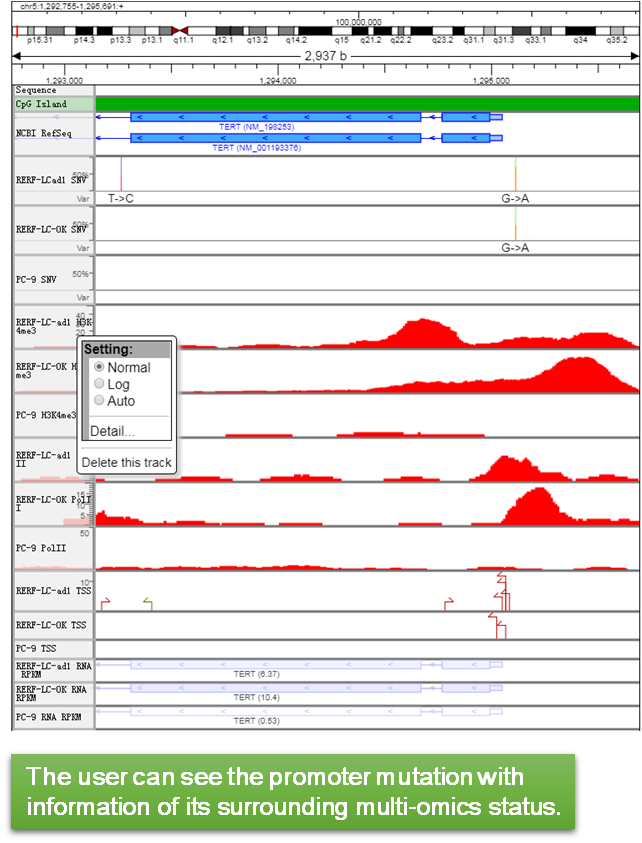
2.If the user want to display additional information such as the substitution pattern and mutant case numbers, use the setting by right-click.
|
|
3.The user also can change the height and color of track in the ‘Detail…’ of the setting.
|
|
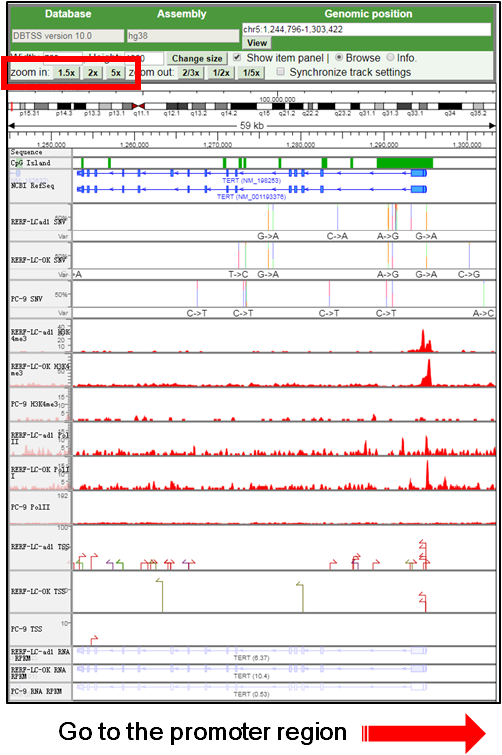
D. Select the cell line datasets for multi-omics status |
|
|
1.Reset the browser and search ‘TERT,’ again.
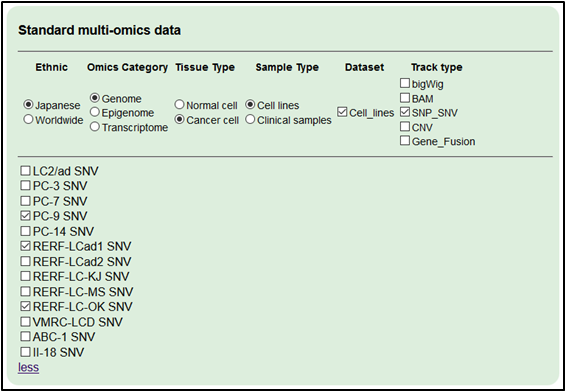
2.Add genome datasets detected (WGS). Select ‘Japanese,’ ‘Genome,’ ‘Cancer cell’ and ‘SNP_SNV.
・RERF-LC-Ad1 SNV
・RERF-LC-OK SNV
・PC-9 SNV’
|
|
|
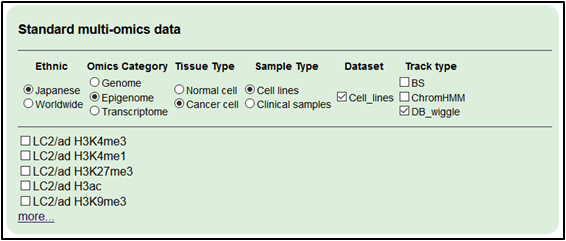
3.Add epigenome datasets (ChIP-seq).
Select ‘Japanese,’ ‘Epigenome,’ ‘Cancer cell’, ‘Cell lines’, ‘Cell_lines’ and ‘DB_wiggle’ (and click ‘more…’).
・RERF-LC-Ad1 H3K4me3
・RERF-LC-OK H3K4me3
・PC-9 H3K4me3
・RERF-LC-Ad1 Pol II
・RERF-LC-OK Pol II
・PC-9 Pol II
|
|
|
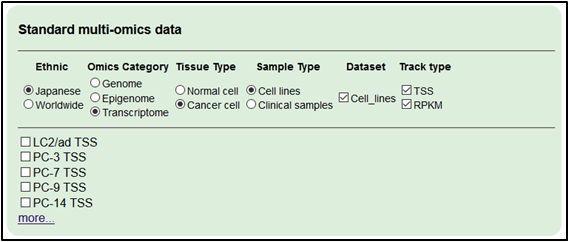
4.Add transcriptome dataset (TSS-seq and RNA-seq).
Select ‘Japanese,’ ‘Transcriptome,’ ‘Cancer cell,’ ‘Cell lines’, ‘Cell_lines’ and ‘TSS’ and ‘RPKM’ (and click ‘more…’).
・RERF-LC-Ad1 TSS
・RERF-LC-OK TSS
・PC-9 TSS
・RERF-LC-Ad1 RPKM
・RERF-LC-OK RPKM
・PC-9 RPKM
|
|
E. Go to the surrounding region of the promoter mutation |
|
|
1.Zoom-out and adjust the region to show the promoter and its downstream gene.
(link )
|
|
|
2.Change visualization by the setting (right-click) in each track
|