Help -- How to use the DBTSS

Quick start Help
 
A.B.
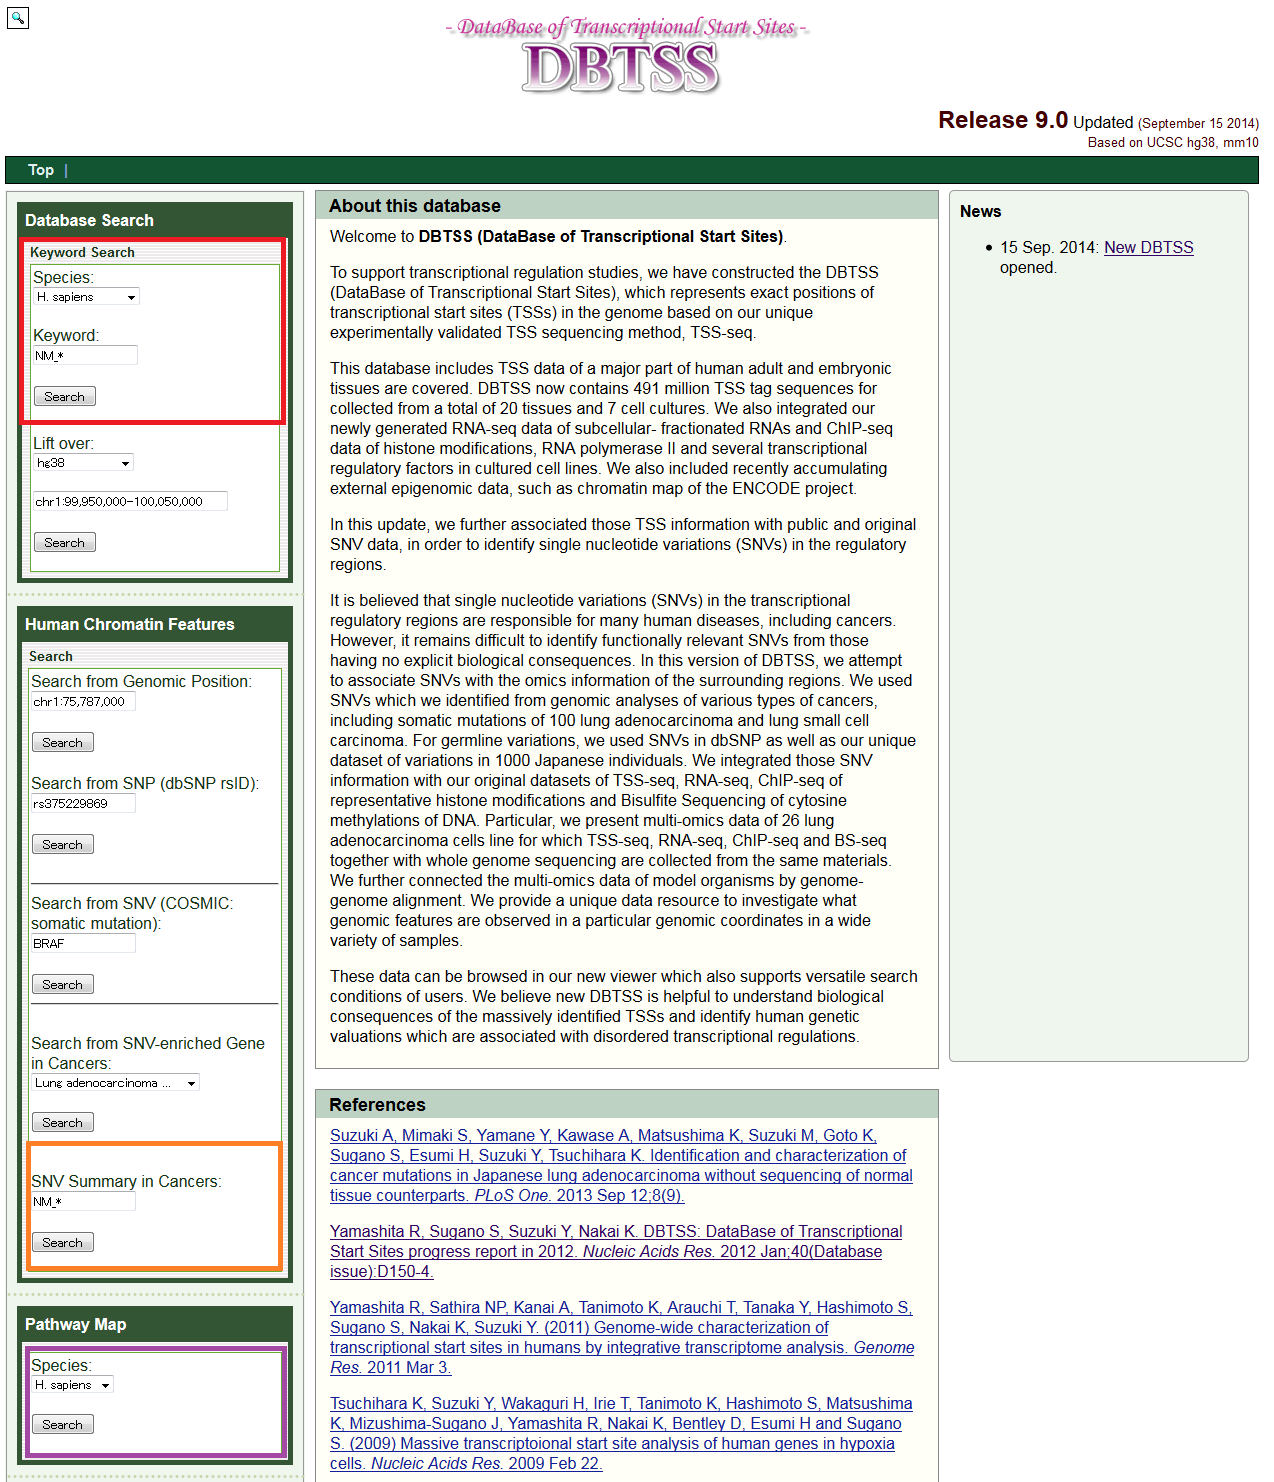
  1. Top page of DBTSS. A simple search for "TSS Viewer" and "Genome Viewer" can be made by specifying a keyword, such as a gene name 'BRAF' in the Database Search at the left frame (red box). Search by "SNV Summary in Cancers" and "Pathway Maps" can be made from the positions indicated by orange and purple boxes, respectively.
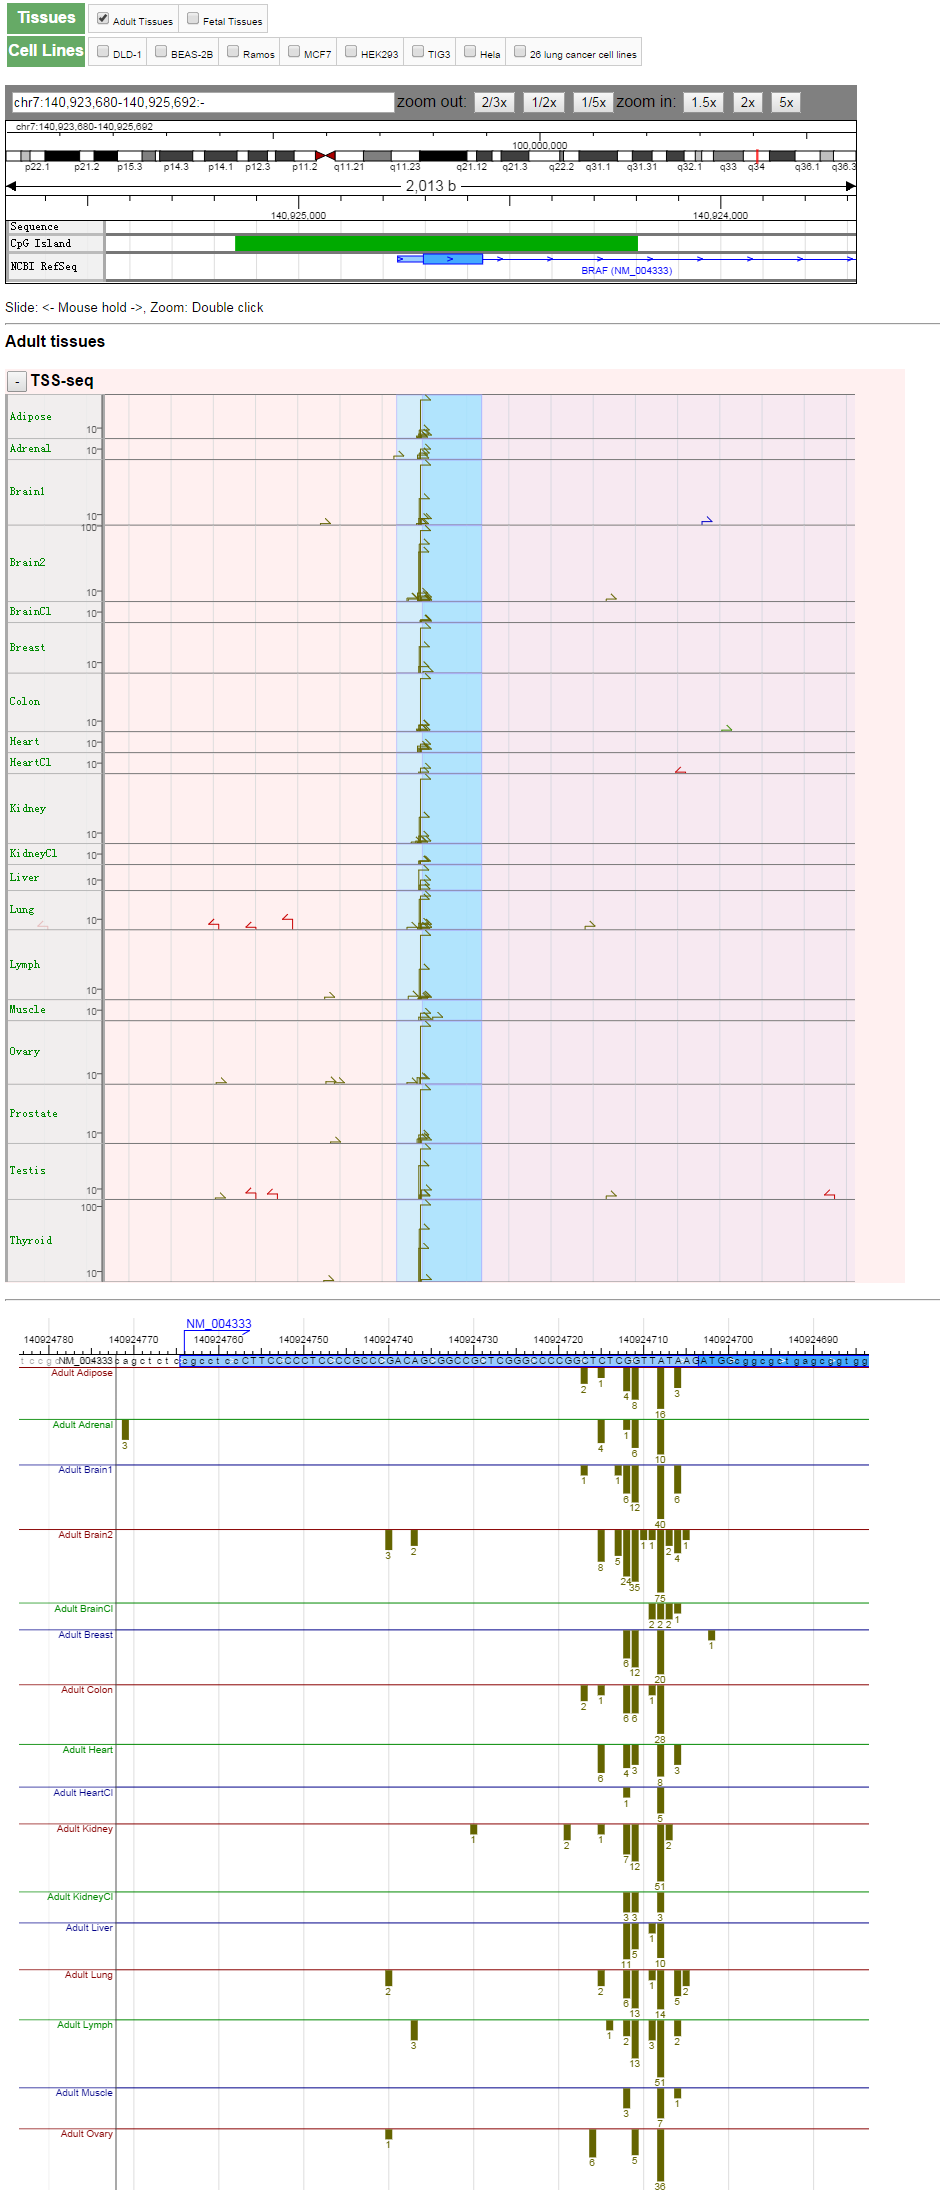
  2. A part of the TSS Viewer display for the BRAF gene. The overview and the detailed positions of the TSSs are shown in the upper and lower panels, respectively. Many of the fields are expandable.
C.D.
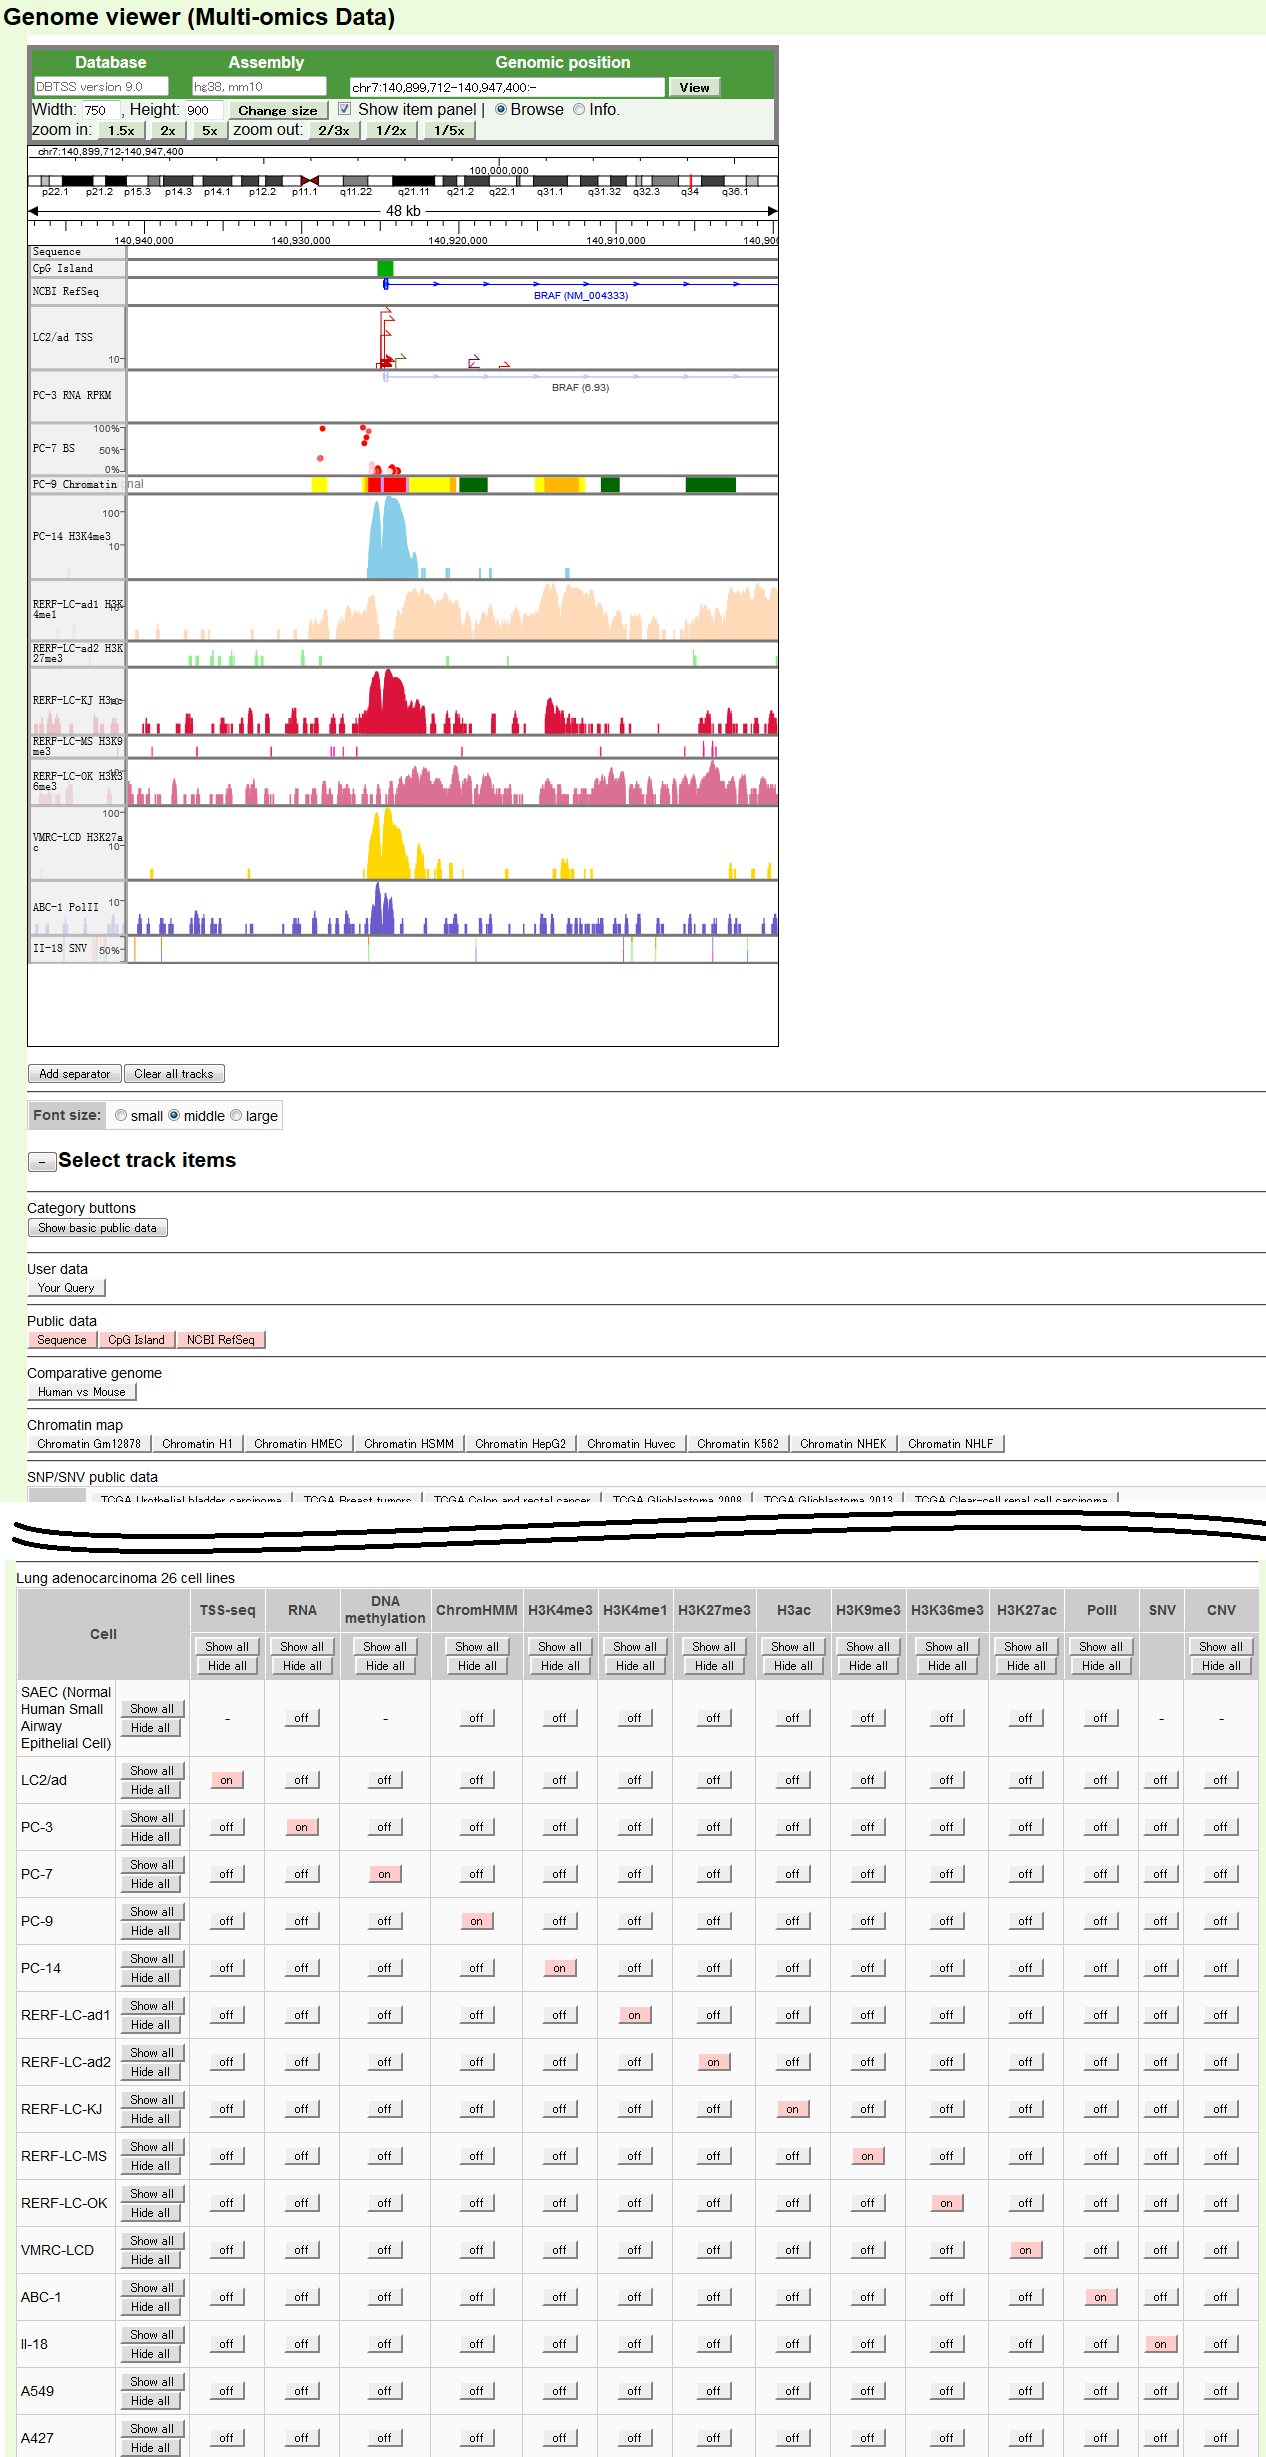
  1. The default display of Genome Viewer for the BRAF gene. Displayed items are as indicated in the margin. The displayed items can be controlled from the panels located under the "Select track items" headline.
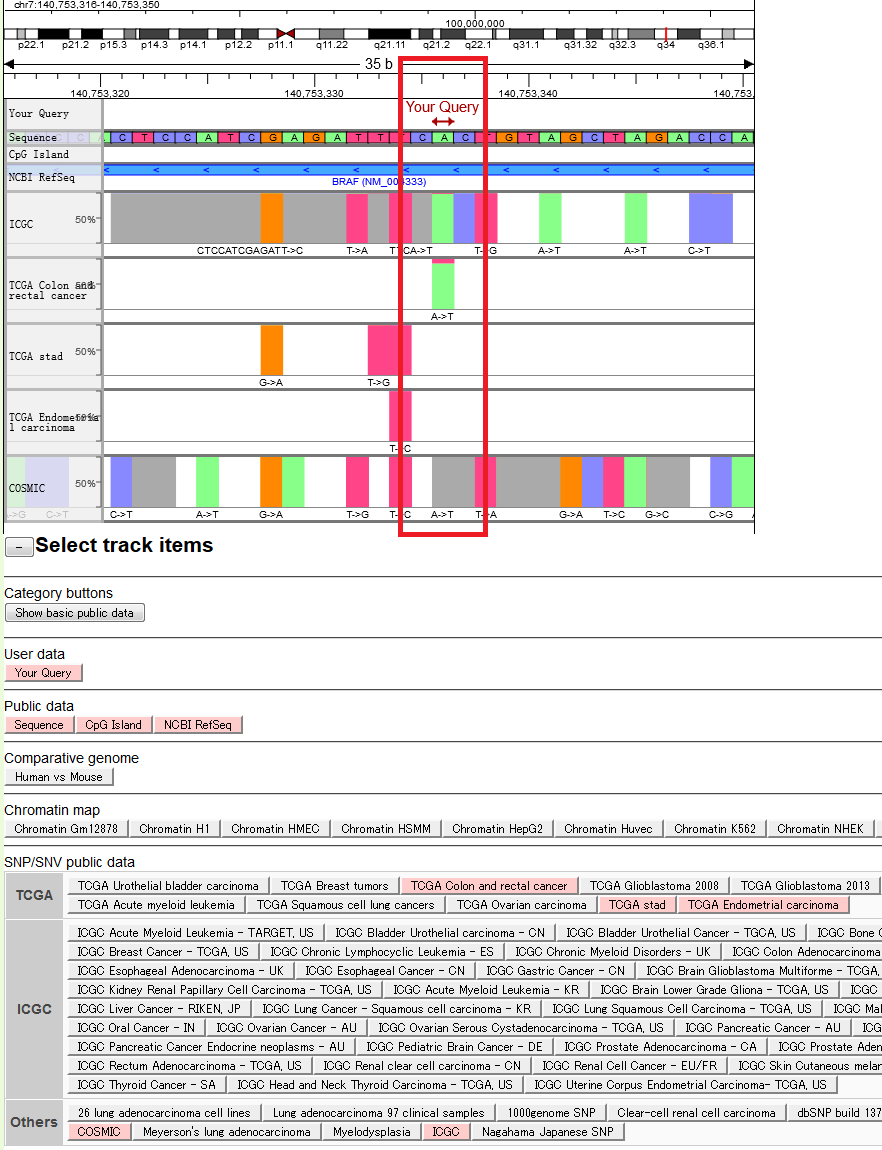
  2. A sample output of SNV information for the BRAF gene. Surrounding region of a previously reported cancer driver mutation (V600E of the BRAF gene; highlighted in red box), is displayed.
E.F.
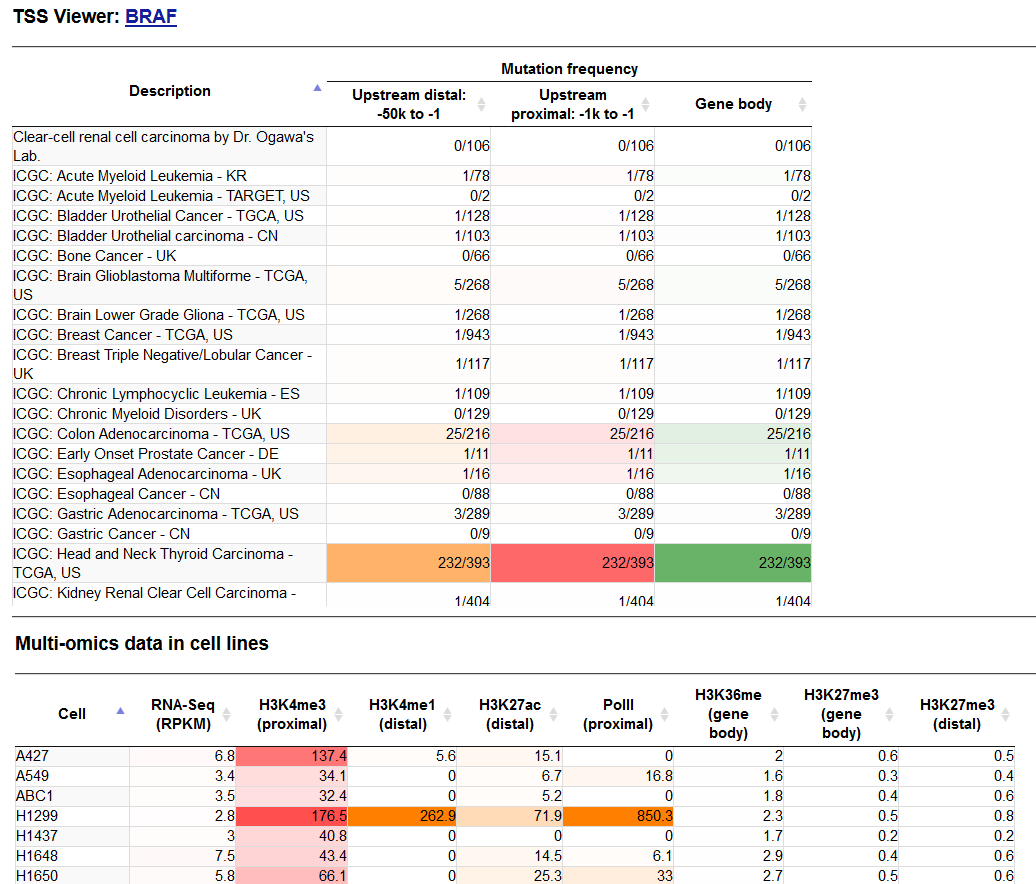
  1. Upper panel: A part of the Mutation frequency table for the BRAF gene. Enriched fields are as highlighted; lower panel: Summary of multi-omics data mainly collected from cell lines.
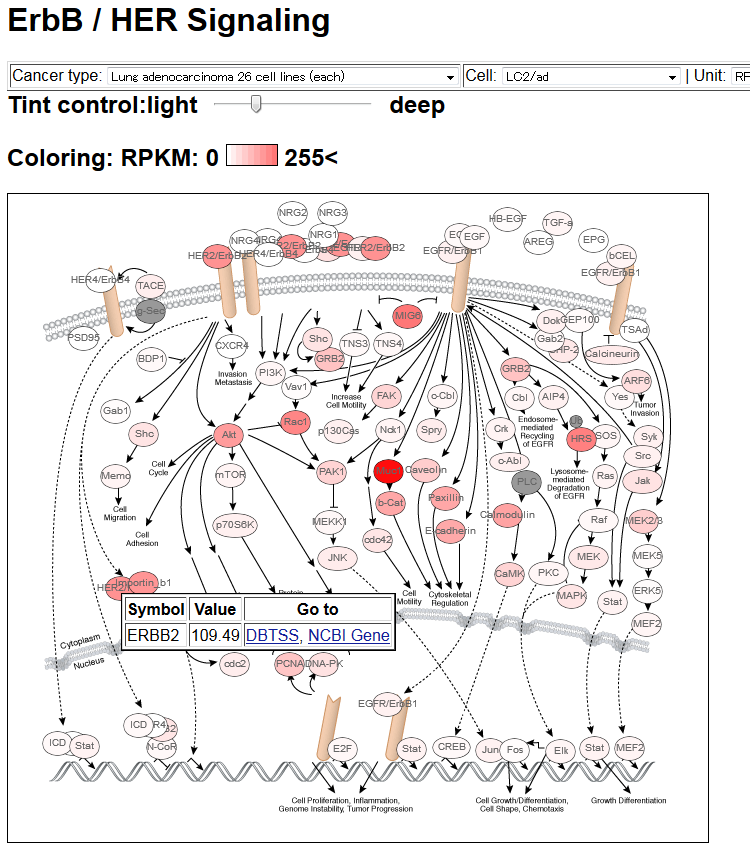
  2. Pathway Map representation of characteristic genes. In this example, gene expression level (in RPKM) of node genes in a lung adenocarcinoma cell line, LC2/ad, in the ErbB/HER signaling pathway is shown. Further links will appear when the users click the circle corresponding to each gene.
 
To top

Left side menu Help
 
  1. Select the species and input the keyword for search
    for the TSS Viewer or Genome Viewer.
  2. Search for the multi-omics data.
  3. Select the species and
    input genomic position or dbSNP ID.
    Further link to Genome Viewer can be
    followed from the linked page.
  4. Input keyword for the COSMIC database.
  5. Select cancer type for Mutation enriched gene list page.
  6. Input keyword for Mutation summary page.
  7. Documents about DBTSS.
  8. Select the species for Pathway map page and KEGG page.
 
To top

TSS Viewer Help
 
  1. Link to Genome Viewer.
  2. Gene information and genome position.
  3. Zoom-in and zoom-out.
  4. Sequence, CpG islands and gene models.
    Drag mouse to slide and double click to magnify. Below TSS viewers will be also moved accordingly.
  5. Select the cell type to be displayed.
    TSS-seq, ChIP-seq, RIP-seq or RNA-seq data, which are collected at the indicated conditions, will appear wherever available.
  6. "TSS region" displays each sample TSS-seq tag number.


To top

Multi-omics Data Summary Help
 
  1. Intensities of the indicated signals in the corresponding datasets at the given genomic position are shown.
 
To top

Genome viewer (Multi-omics Data) Help
 
  1. Tracks to be displayed can be selected by the buttons below. see "Select track items" (C).
  2. The items shown in the Viewer can be selected:
    • Right click to change the scale ("Browse" should be checked at (B')).
    • Click information to link to NCBI or TSS Viewer ("Info" should be checked at (B')).
  3. Select track items
    • General information
    • "Comparative genome" to show information in the mouse counterpart gene
    • "Chromatin map" to show in the ChromHMM map as appeared in ENCODE
    • SNP/SNV public data to show SNV information in outer databases, such as TCGA and others including ICGC and dbSNP)
    • Multi-omics data collected from cell lines
      Press buttons to show/hide the indicated item. Highlighted items are shown in the Viewer.
    • ChIP-seq: Normalized tag counts of the ChIP-seq at the corresponding genomic potistion.
    • BS-seq: Degree of DNA methylation as indicated on the vertical line at the CpG site of the indicated genomic position.
      Color intensity represents the sequence depth.
    • SNV: Base substitution pattern. Length of the vertical line shows the base proportion as represented by the read counts.
      Substitution pattern from the reference genome is shown below margin.
 
To top

COSMIC list Help
 
  1. "Genomic position" is linked to genomic position summary page.
 
To top

Mutation enriched gene list Help
 
  1. "Position" is linked to Genome viewer.
 
To top

Mutation summary Help
 
  1. "Expression feature" is linked to expression feature page.
 
To top

Expression feature Help
 
  1. Mutation frequency in the indicated dataset and regions are shown.
  2. "Genomic position" is linked to TSS Viewer.
  3. Multi-omics data collected in cell lines for the indicated genes. Signal intensities in the indicated analyses are shown.
 
To top

Pathway map Help
 
  1. Signal intensity for the corresponding genes is shown.
    Choose the dataset, cell types and the category.
    Optimize the color code by sliding the pointer.
 
To top

KEGG map Help
 
  1. Select the item as shown above.
 
To top