E. This track displays the TSS Seq cluster represented by >=5ppm(parts per million).
If the left check box (all condition, ChIP seq, RNA seq) is selected, the corresponding data is visible.
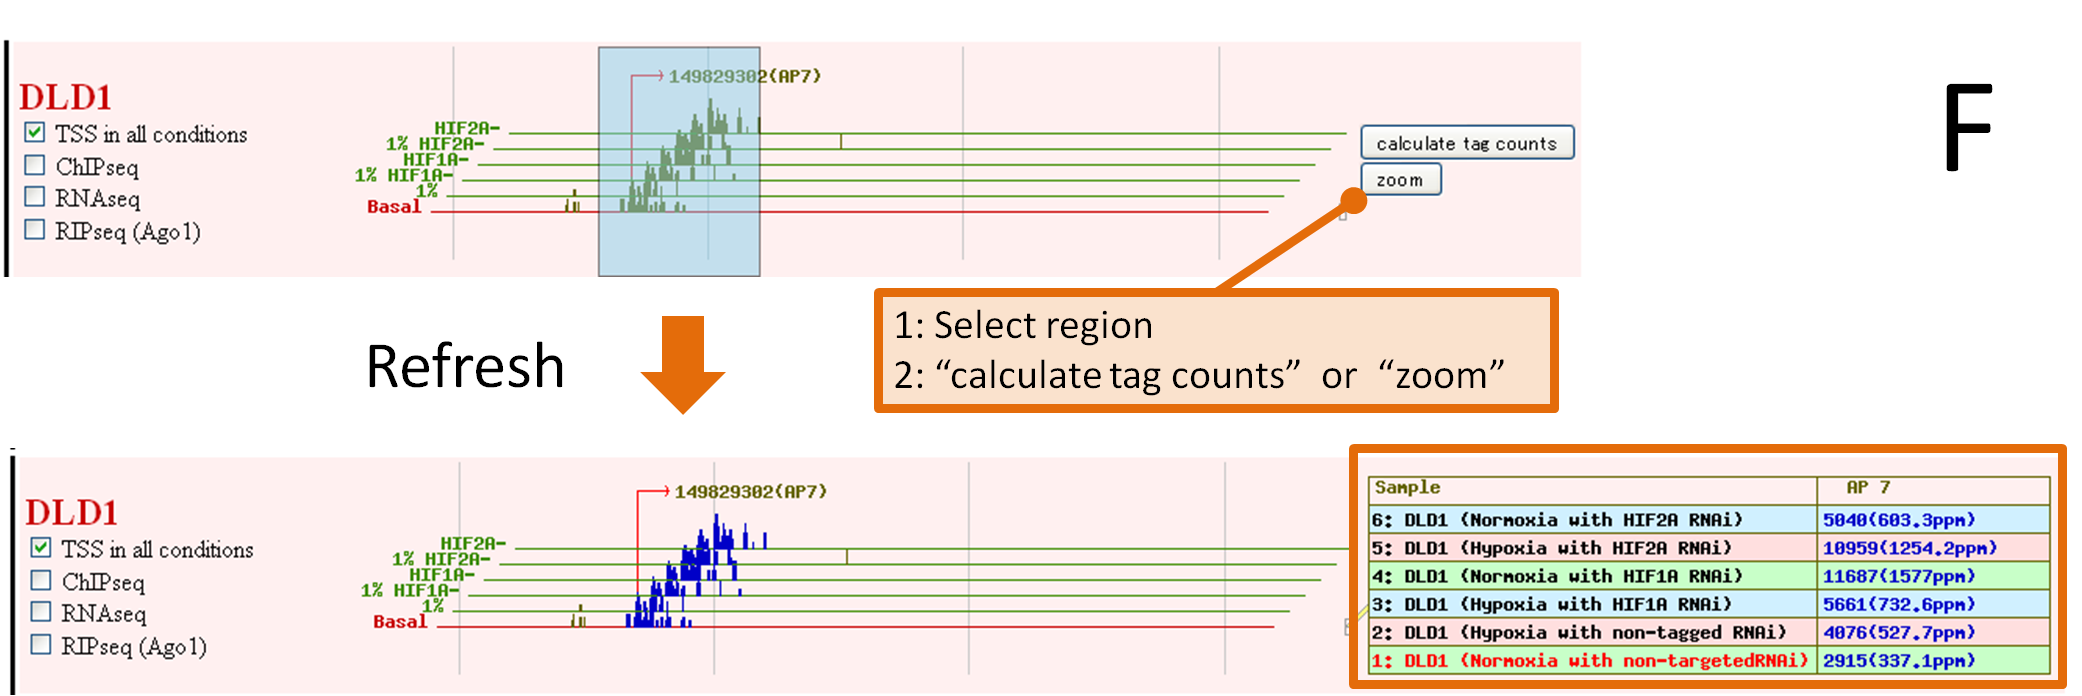
F. Drag your target region, 2 functional buttons. "calculate tag counts" or "zoom" are visible.
Click the button, the data you request is displayed.
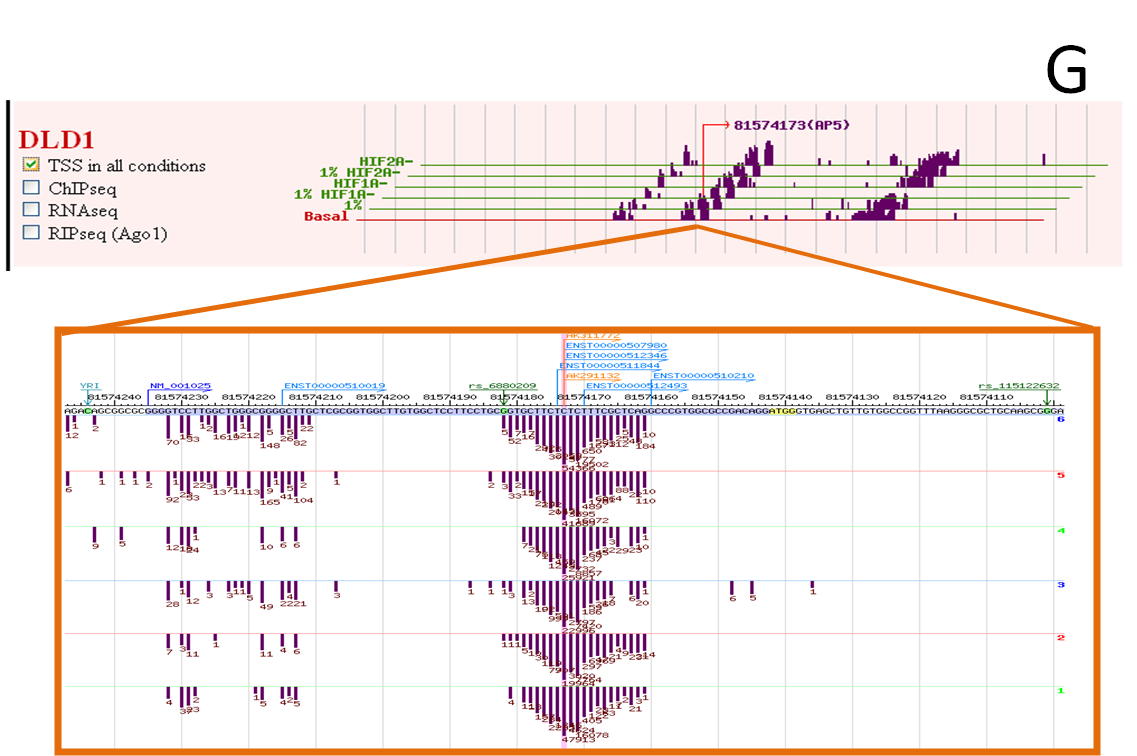
G. The under frame displays each sample TSSseq tag number.
Click the AP position in the upper frame, highlight the position in the under frame.